
Cryptocurrencies are poised to continue unwinding speculative excesses, as trends off record levels and since the spring remain pointed firmly lower. Even though they are way off record highs, there is still room to go on the downside and price action continues to support this notion. Last week we took a look at Bitcoin and Ethereum, this week we’ll look at charts of Ripple and Litecoin. All posting similar price sequences, but with their own twists.
See how positioning changes on the IG Client Sentiment page can help identify price direction in cryptocurrencies and other major markets.
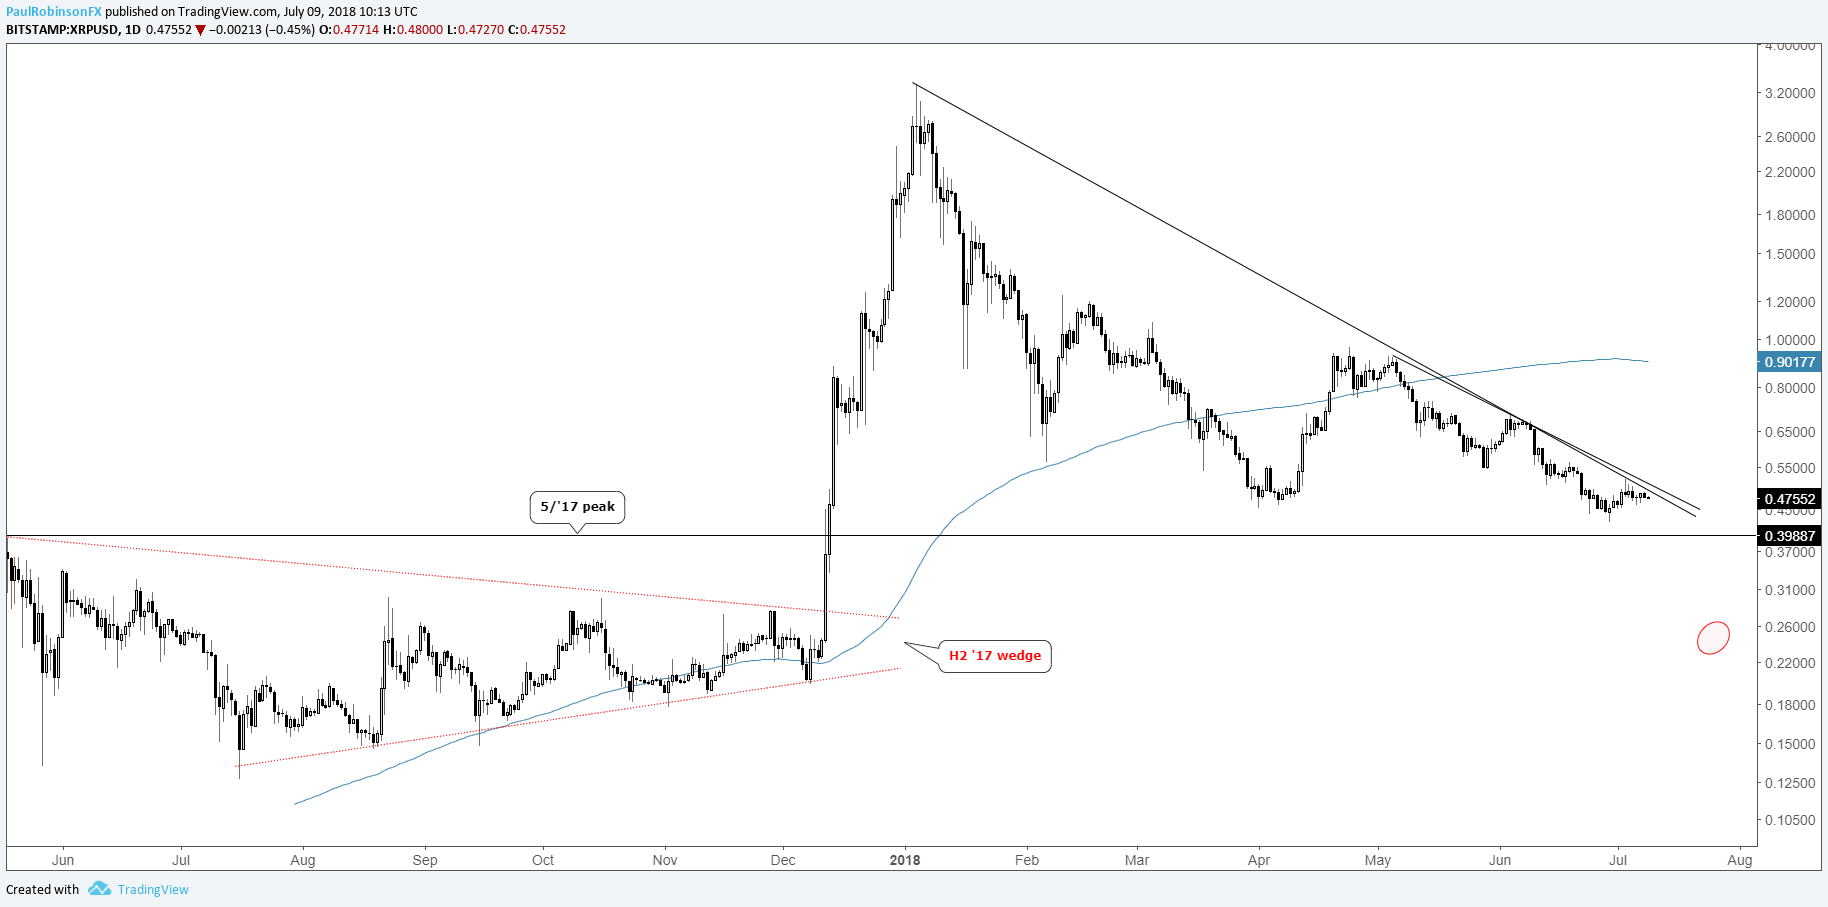
Ripple (XRP/USD) set to continue dripping lower, still looking for 25-cents
While Ripple is ~85% off record highs set in January, it can still go lower. Earlier in the year, the longer-term target for XRP/USD was set at the apex of a wedge built during the second-half of 2017, erasing the entire rise during December into January. This target still stands and is around the 25-cent mark. That will be about 92% off record levels, or another 48% from the current price.
Looking at the short-term trend structure, there is a clear sequence of lower lows and lower highs since May. We could see another bump higher as we did back in April/May before extending towards the big-picture target, but for now we’ll use the two trend-lines as guidance for lower prices. Break above and perhaps we’ll see a larger rebound ensue (before rolling over again).
Check out this guide to learn more about how to trade Bitcoin and other cryptocurrencies.
XRP/USD Daily Chart (25-cent target remains)
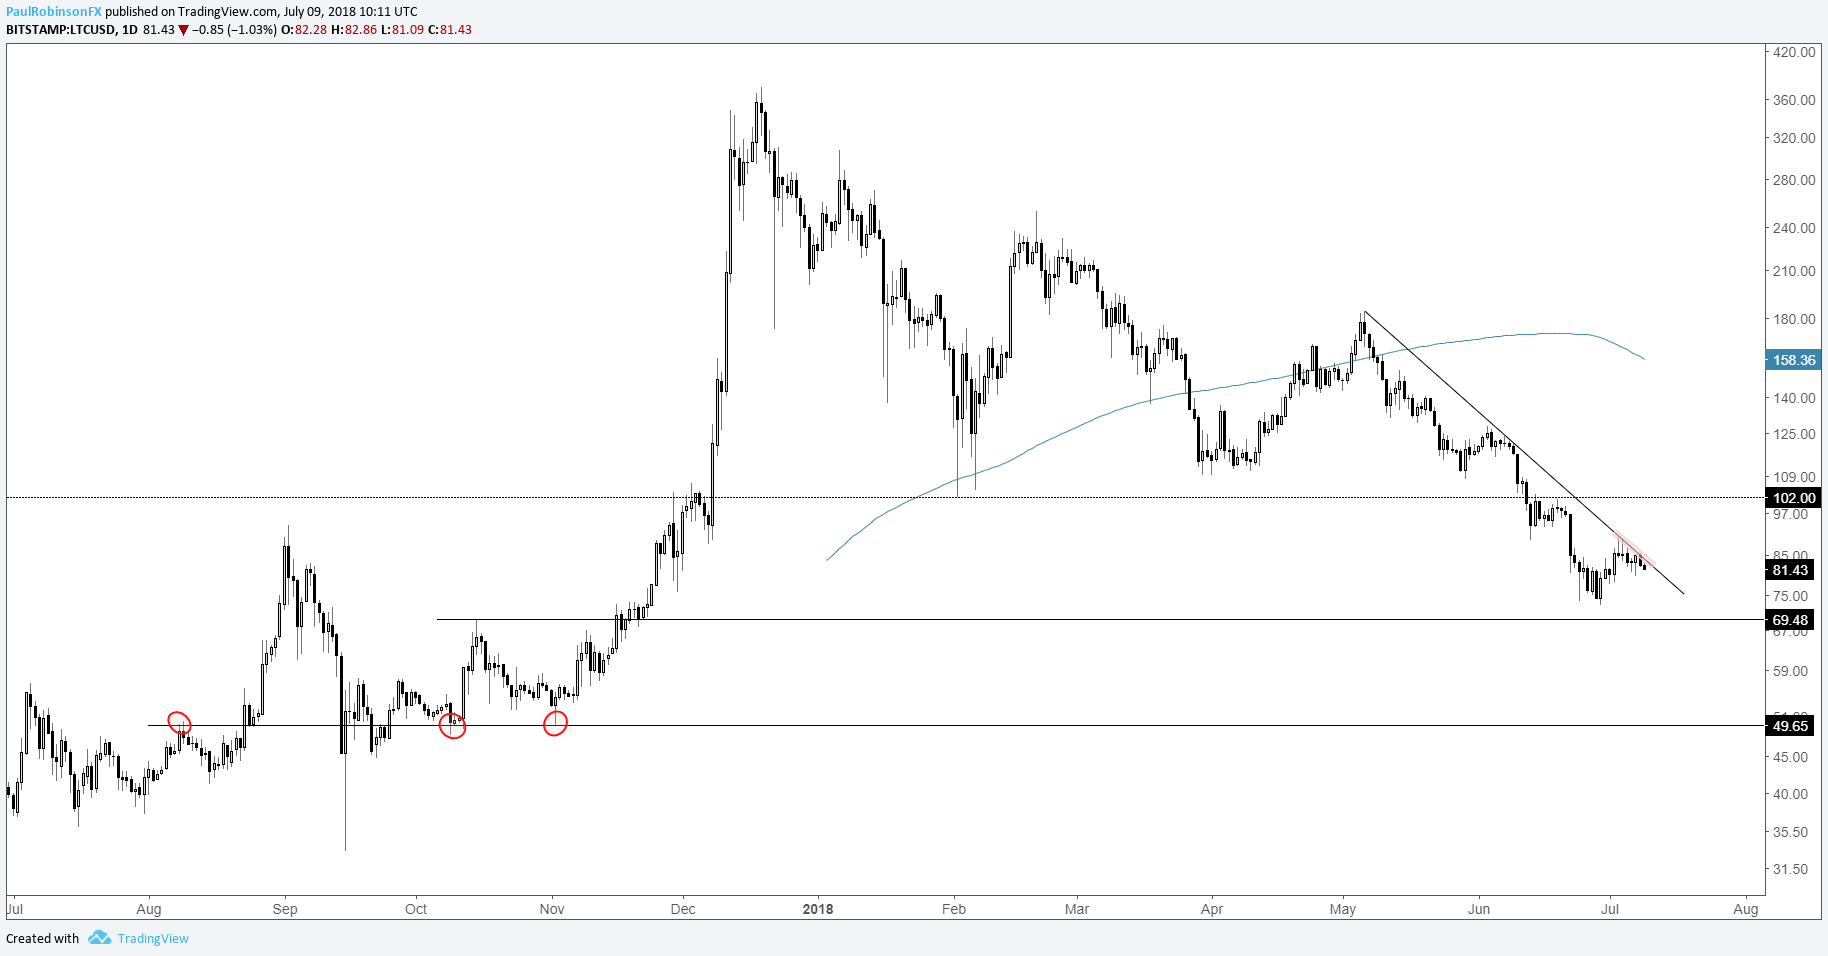
Litecoin (LTC/USD) turning down from trend-line resistance
The most recently broken threshold of significance for Litecoin was the 100-line, and with it in the rear-view mirror there is still more room on the downside. Unlike Ripple, the end target is not as clear, but more damage is anticipated and seeing it probe into the 40s or worse looks quite possible given the magnitude of the overall reversal in speculative fervor.
The next level of support arrives around 69, then just under 50. Trend-line resistance off the May swing-high was just tagged on a couple of occasions in recent trade; this will be our guide in the near-term.
LTC/USD Daily Chart (Rolling lower off trend-line)
Helpful Resources for Cryptocurrency Traders
Whether you’re a new or experienced cryptocurrency trader, we have several resources to help you;Introduction to bitcoin trading guide, indicator for tracking trader sentiment, and a weekly webinar discussing the latest developments.
—Written by Paul Robinson, Market Analyst
You can follow Paul on Twitter at @PaulRobinsonFX


