
Over the weekend cryptocurrencies were taking a hit, but have found buyers at key spots in several of the major names. Bitcoin and Litecoin both reversed around important trend-lines, while Ethereum had the most dramatic reversal at the top of a plateau created late last year. Bullish reversals may lead to strength in the near-term, but the broader trading bias following rallies remains lower as the speculative unwind has further to go.
Traders are generally long Bitcoin, suggesting more weakness; See how positioning changes can help determine price direction on the IG Client Sentiment page.
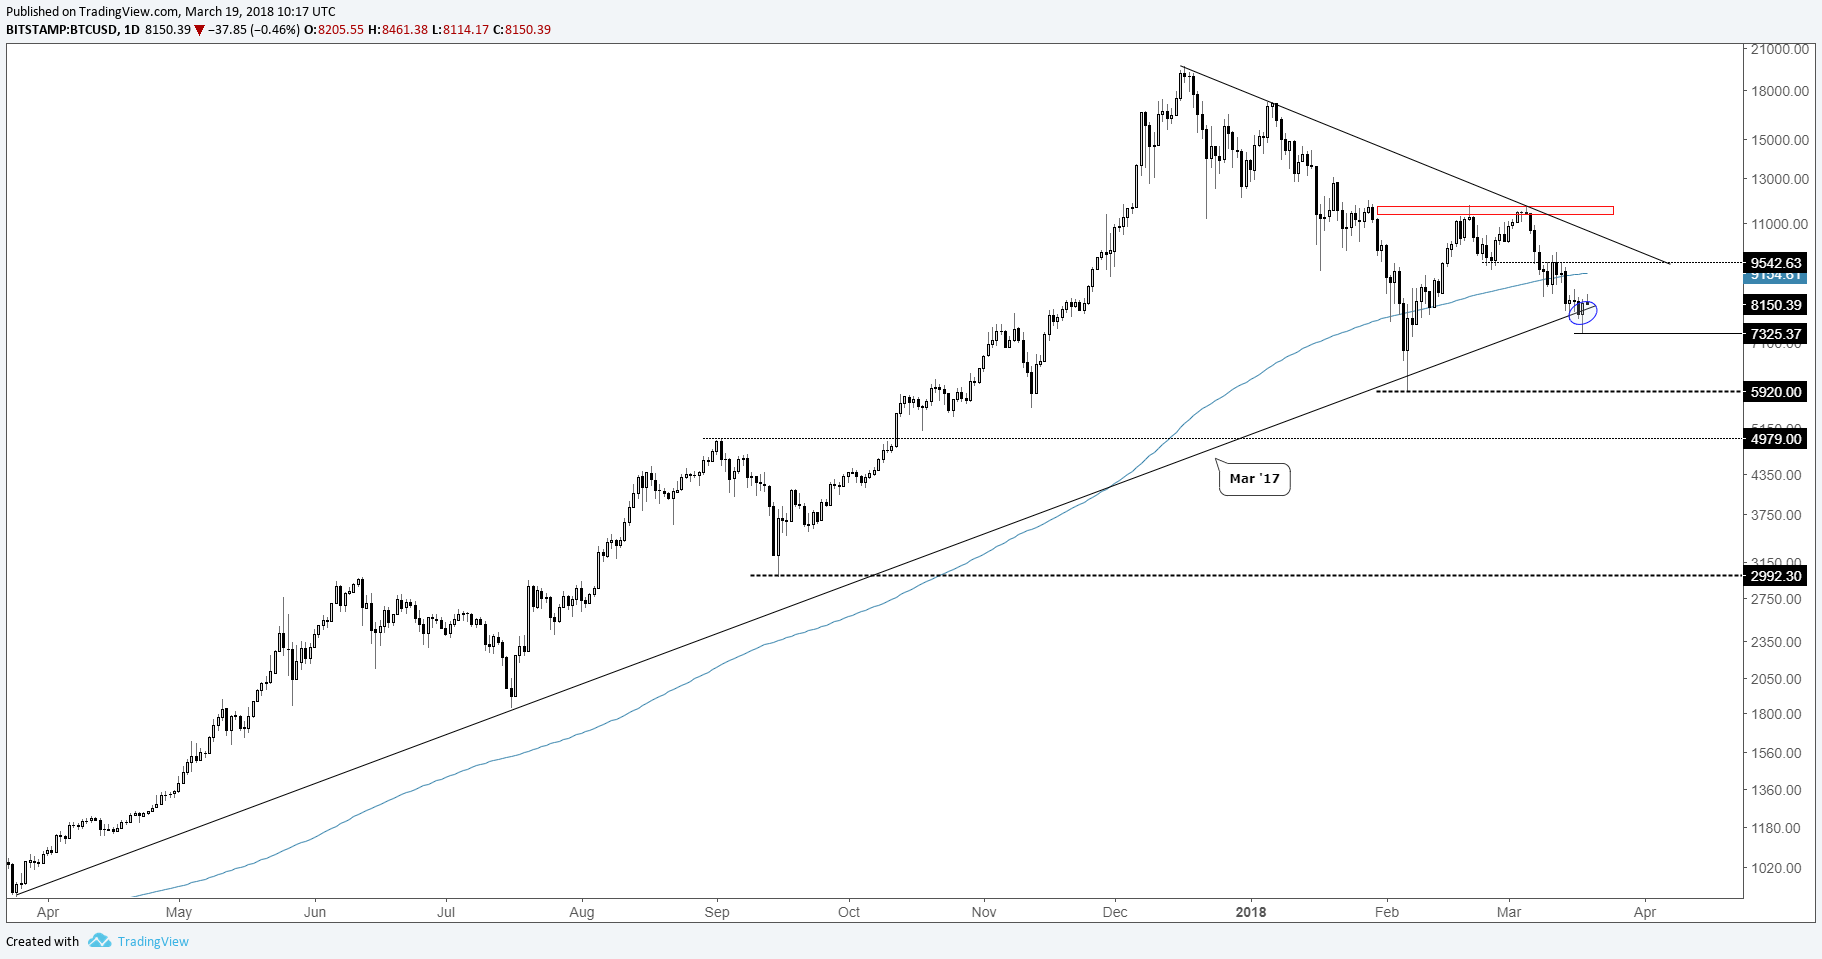
Bitcoin buyers show up around 1-year trend-line
Bitcoin halted its decline yesterday with a solid reversal from around a trend-line dating back to March of last year. It wasn’t the most dramatic of turnarounds, but enough to put in a floor in the near-term. As long as yesterday’s low at 7235 holds a bounce back towards 9500 may be in store, an area it recently struggled at. Should it grow legs, the trend-line off the December high clocking in at over 10k could come into play.
If yesterday’s reversal is negated, then look for the swoon to continue with the next major support level not arriving until the Feb spike-low at 5920. Whether Bitcoin can find more buyers or not, the broader outlook remains negative with rallies seen as corrections in the speculative unwind.
Check out this guide to learn more about how to trade Bitcoin and other cryptocurrencies.
BTC/USD Daily Chart (reversal at trend-line)
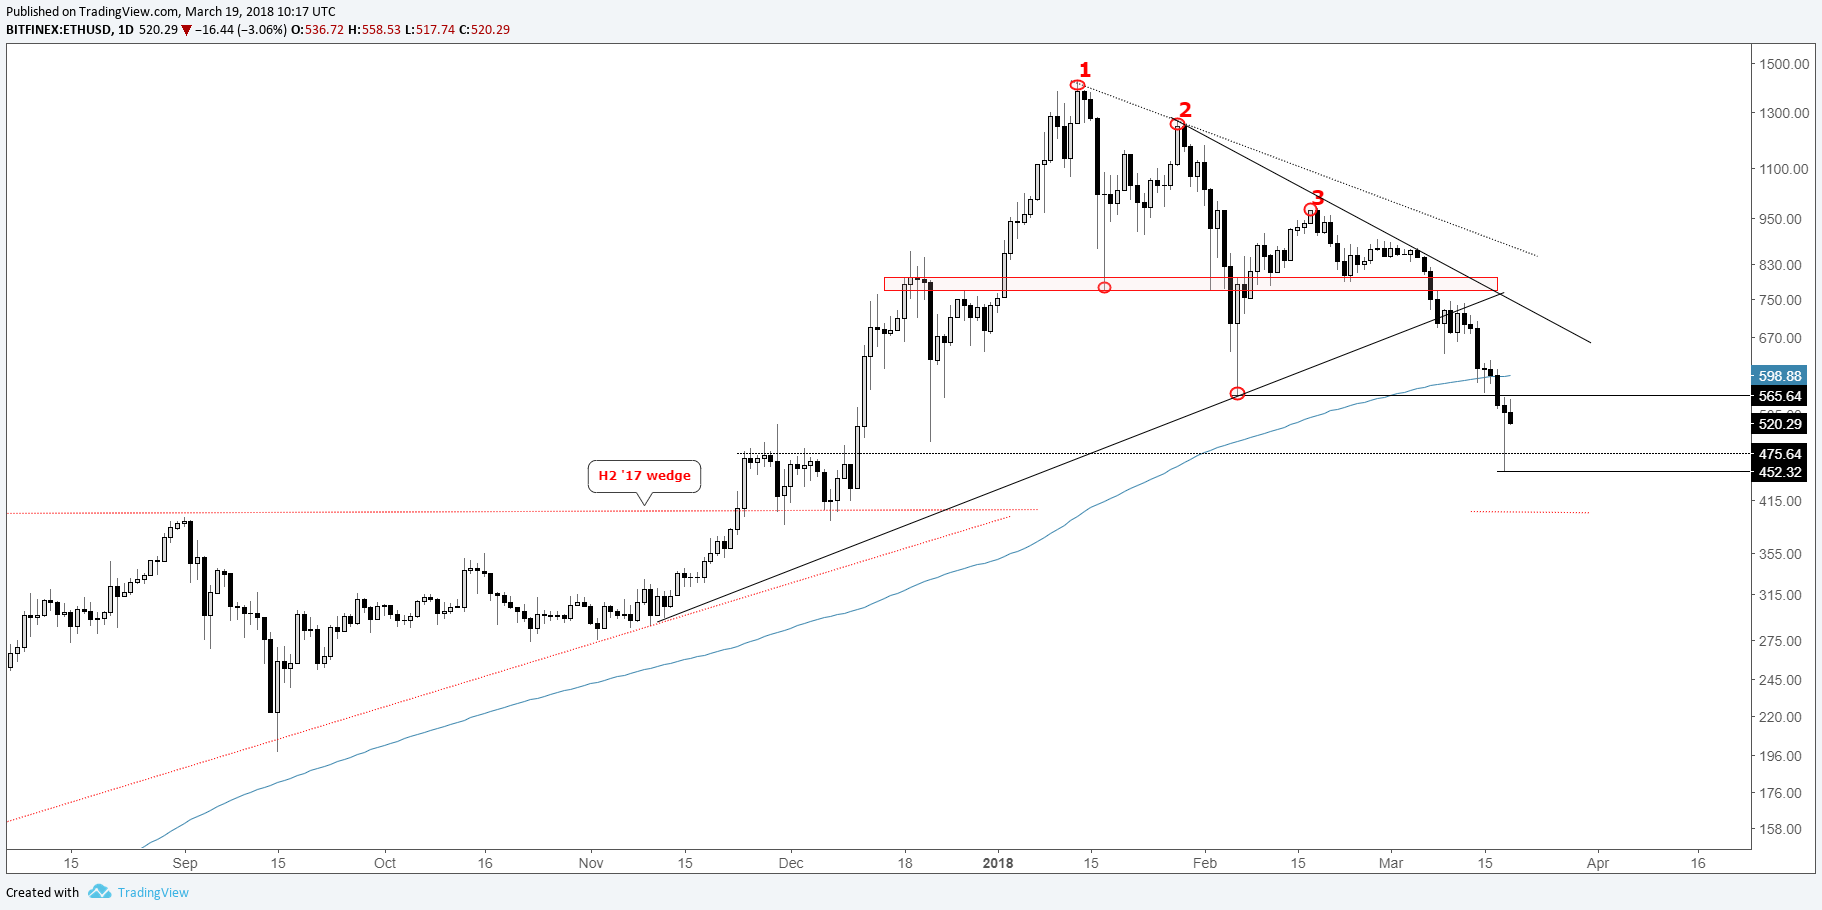
Ethereum finds support around a plateau created last year
Ethereum had the most dramatic reversal yesterday as it neared the targeted apex of the wedge which formed during the second-half of last year. Before reaching this target, however, buyers showed up around the top of a consolidation period created during November/December.
The key-reversal bar is seen as a low for now, but looking immediately higher the Feb spike-low at 565 will need to be first overcome if ETH/USD is to start a recovery. If it can climb firmly above 565, then the 200-day at 599 is up next, and beyond there it has room to run higher.
Overall, though, as is the case with the rest of the group, a recovery bounce may be all that we see before downward pressure reasserts itself.
ETH/USD Daily Chart
Litecoin trying to turn higher off 6-month trend-line, 200-day
Litecoin found sponsorship at a confluence of support levels via a trend-line dating back to September and the 200-day moving average. This confluence of support is seen as a floor for LTC/USD, and as long as it doesn’t trade back below yesterday’s low at 137, a bounce back to the trend-line off the record high may be in store.
Trade below 137 will have lows from February in the 102/04 range in focus as the next level of highly visible support.
LTC/USD Daily Chart (reversal at confluence of support)

Helpful Tools for Cryptocurrency Traders
Whether you’re a new or experienced cryptocurrency trader, we have several resources to help you;Introduction to bitcoin trading guide, indicator for tracking trader sentiment, and a weekly webinar discussing the latest developments.
—Written by Paul Robinson, Market Analyst
To receive Paul’s analysis directly via email, please SIGN UP HERE
You can follow Paul on Twitter at @PaulRobinsonFX


